Motors
A practical guide to identifying the origin of the defect in medium and high voltage motors and generators.
Summary. Detecting partial discharge (PD) is relatively easy; knowing where the defect sits and what type it is, is not. This article explains the geometric location method enabled by the rotating machine monitor (RMM) with the RTD-PD module: how the sensors are distributed along the winding, what each one contributes, how to read phase patterns and polarity, and how to confirm the diagnosis against the time trend. It is illustrated with two real Dynamic Ratings case studies, one of which avoided a forced outage and saved an estimated USD 70,000.
What we are locating, and why
Partial discharges are small electrical discharges that do not completely bridge the insulation between conductors. They typically originate in voids, cracks or inclusions inside a solid dielectric, or at conductor-dielectric interfaces. Their level grows progressively as the insulation degrades, so continuous monitoring makes it possible to detect deterioration before it causes a failure and to schedule a planned outage — far cheaper than a forced one.
Locating the fault means answering three questions from the PD data:
- Where is the defect? Which area of the winding, which slot, which phase.
- What type is it? Internal void, loose winding or a slot exit problem.
- How is it evolving? Whether activity is growing, stable, or responding to a repair.
No single data point resolves this. Location emerges from cross-referencing the physical position of the sensors, the phase pattern, the polarity and the correlation with operating conditions. If you would like to review the fundamentals first, we have dedicated articles on the types of partial discharges and the detection methods of partial discharges.
How the origin is located, step by step
Exploit the spatial distribution of the sensors
The key to location is that different sensors cover different areas of the winding. Combining them narrows down the problem region:
- Coupling capacitors (CC): installed at the line terminals. Because of signal attenuation, they only detect PD in roughly 10–15 % of the winding (the part closest to the terminal). Deep defects go unnoticed by them.
- RTDs used as PD sensors: located inside the slots and distributed along the winding. They act “like a pair of binoculars”, letting you see far more of the winding than the CCs alone.
- Stator slot couplers (SSC): they have a limited “sensitivity zone” and only detect PD in the specific slot where they are installed.
Since you cannot know in advance which sensor will pick up the most PD when the system is installed, the recommendation is to use RTDs and coupling capacitors as complementary devices. By comparing which sensor — and in which position — records the highest magnitude, the affected region is identified.
Identify which numbered sensor shows the most activity
The practical step is to review activity channel by channel. Every CC and every RTD has a known physical position; the sensor with the highest Qmax (maximum PD magnitude) points directly to the area of the winding or the slot where the problem is concentrated. The monthly trend of each channel also shows which sensor “takes off” over time.
Interpret the phase pattern and the polarity
Phase plots (PD plots, with the angle from 0 to 360°) reveal the type of defect:
- Balanced polarities + correlation with operating parameters → suggest void-type defects inside the insulation structure.
- Different patterns may point to loose windings or to problems at the slot exit points.
There is a very useful symmetry nuance for locating in depth: RTDs occupy a symmetrical position between the stator bars, while the SSC sits in an asymmetrical position. In addition, PD from the bottom bar is shielded by the top bar, so the SSC is less sensitive to discharges from the bottom bar. Comparing both sensors helps discern whether the defect is in the top or the bottom bar of the slot.
Correlate with operation and with the time trend
- Monitoring during a motor start shows whether the winding is tight: if PD is unaffected by the starting forces, the winding is firm and the origin is more likely an internal void than mechanical looseness.
- Following the trend over time (months or years) confirms whether activity is growing and whether a repair had any effect. If PD does not drop after an intervention, the origin was not where the work was done.
Procedure at a glance
- Install complementary sensors: RTDs in the slots and coupling capacitors at the terminals, to cover the whole winding.
- Review PD magnitude per numbered sensor to narrow down the physical area of the defect.
- Analyse the phase patterns and the polarity to classify the defect type (void, looseness, slot exit).
- Use RTD/SSC symmetry and the shielding between bars to distinguish top bar from bottom bar.
- Correlate with operating parameters (e.g. a start) and with the historical trend to confirm the origin and validate repairs.
Real case: 13.8 kV motor
A large-machine motor showed significant and growing PD activity across several years of periodic measurements. The highest levels were reported on RTDs 3, 4 and 6. Because of the balanced polarities and the correlation with operating parameters, Dynamic Ratings concluded that void-type defects existed in the insulation structure. Since PD was monitored during a start with no adverse effects, the winding was deduced to be tight.
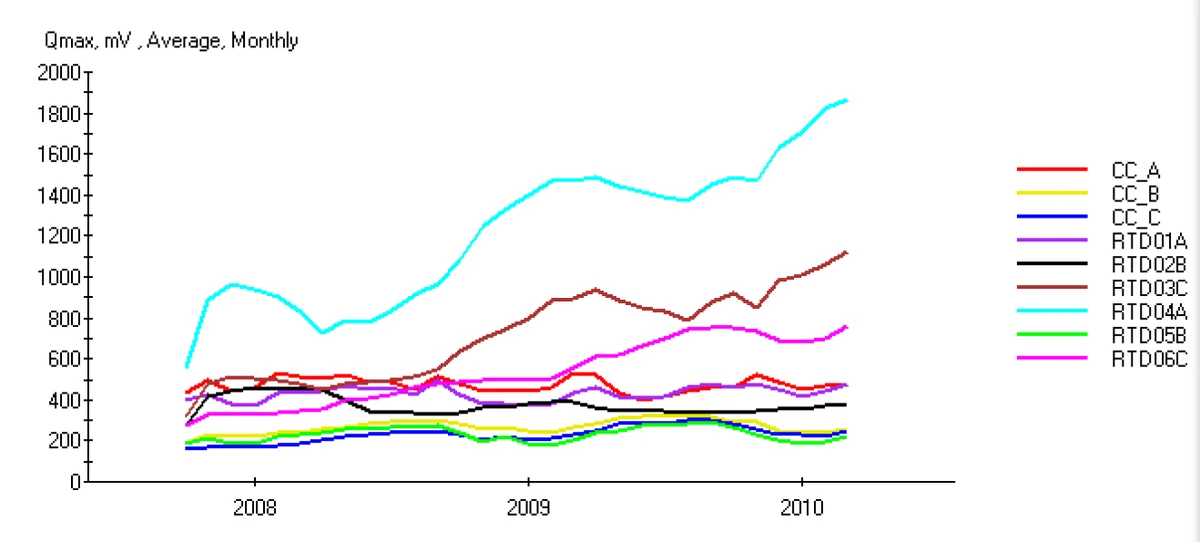
After periodic testing, one supplier concluded that most of the defects were due to loose windings or slot exit points. The customer sought a second opinion, given the economic importance of the machine and its long replacement lead time. During the March 2010 outage, an external inspection found the winding tight and with no sign of PD at the slot exit; the consultant applied additional gradient paint in the hope of reducing activity.
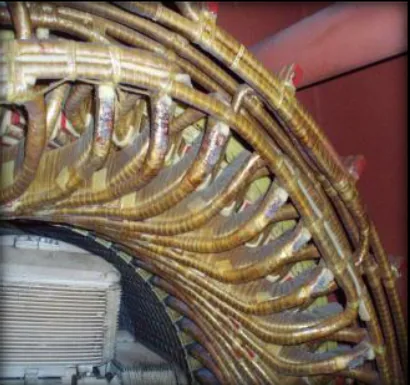
Dynamic Ratings was called in. Data was collected and analysed with the rotating machine monitor: after the outage, PD activity had not decreased and was still rising, which proved that the gradient paint had no effect and therefore that the origin was not at the slot exit but inside the insulation (voids), exactly as the phase patterns indicated.
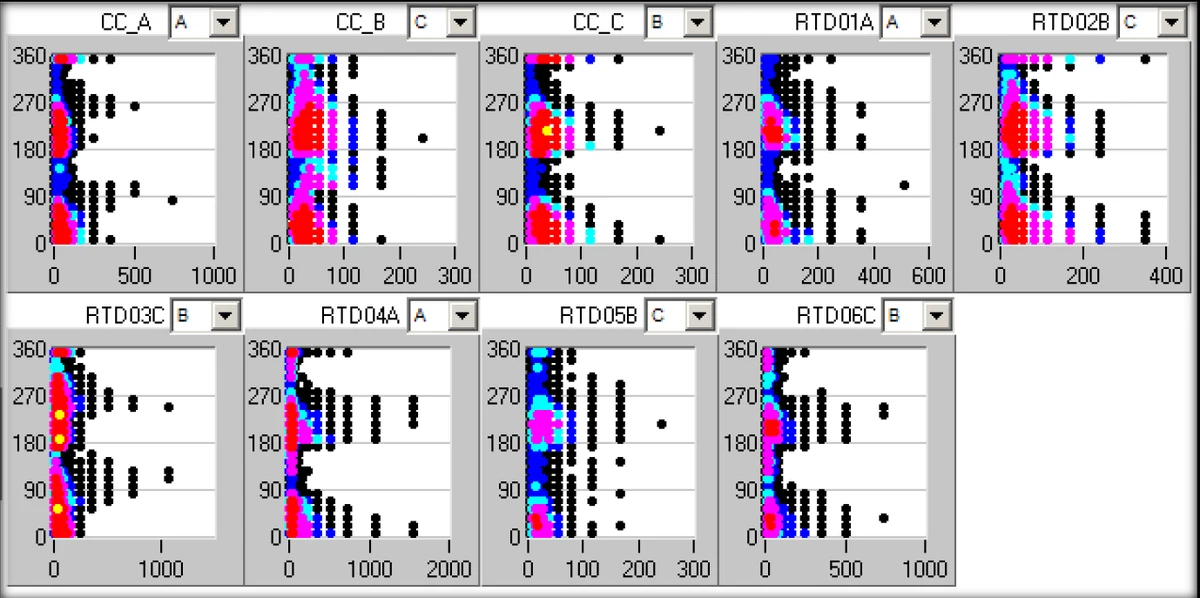
Outcome. Continuous monitoring made it possible to take the right decision on the machine, and the customer documented an estimated saving of USD 70,000 as the difference between a planned outage and a forced one. The location lesson is clear: the sensors with the highest magnitude (RTDs 3, 4 and 6) pointed to the area, and the phase pattern pointed to the type of defect (void), correcting the initial “loose winding” diagnosis.
Complementary case: why combining sensors improves location
On a 300 MW, 20 kV generator equipped with SSCs, RTDs were installed in the same slot, directly beneath the SSC, between the top and bottom bars. Simultaneous measurements showed that both sensor types have almost identical sensitivity and virtually the same PD patterns; the minor differences are explained by the symmetrical position of the RTD versus the asymmetrical position of the SSC.
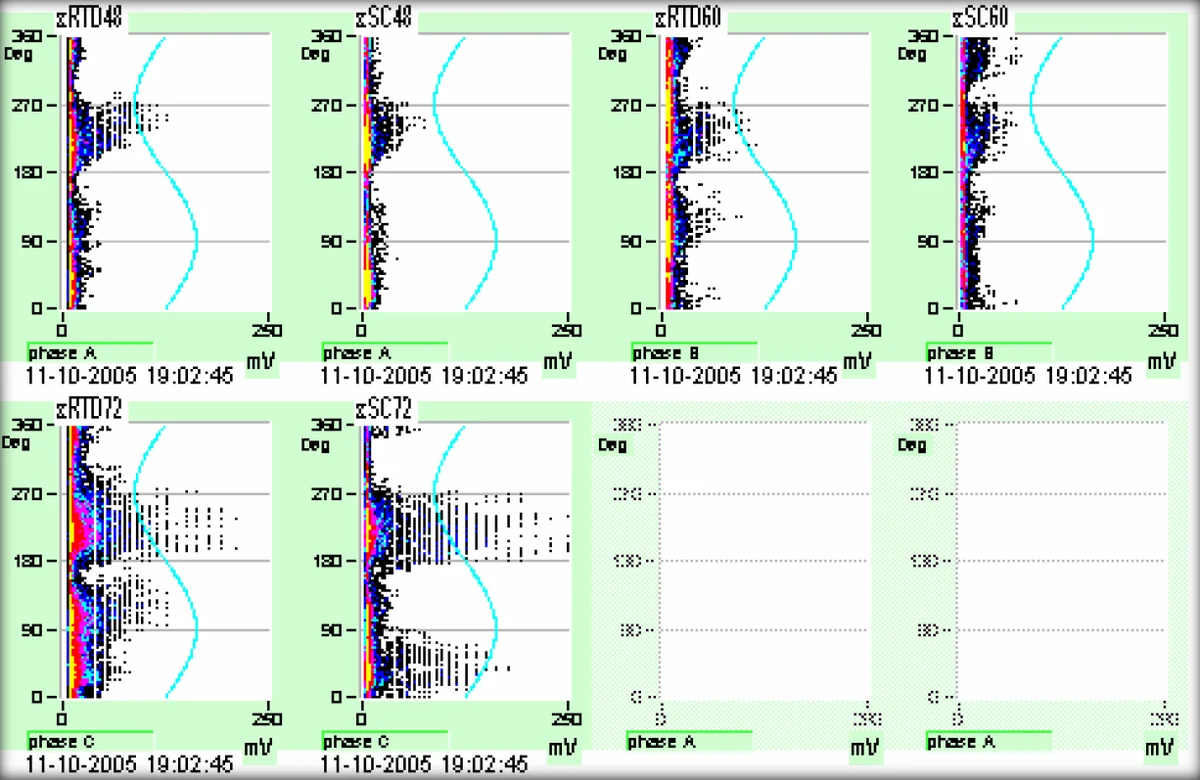
The magnitude distribution per sensor demonstrates the value of combining them: depending on the measurement, sometimes the coupling capacitors stand out and sometimes the RTDs do. Since the CCs only “see” the 10–15 % of the winding closest to the terminal, RTDs distributed through the slots make it possible to locate deep defects the CCs would not detect.
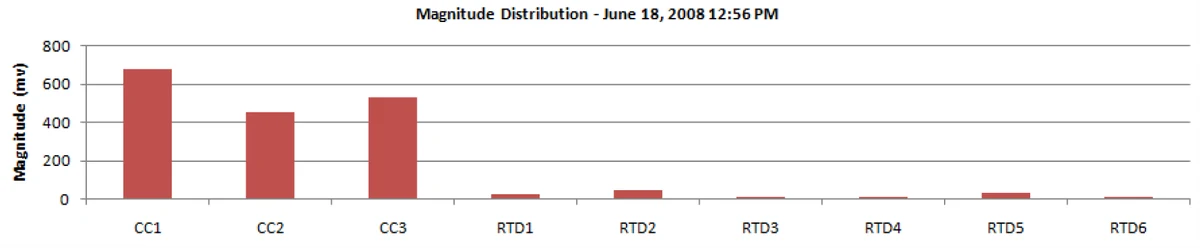
Location conclusion: RTDs and coupling capacitors are complementary, not mutually exclusive. Using both gives a deeper, gap-free view of PD activity — necessary to place the defect in the right area of the winding and to avoid misdiagnosing its nature.
Frequently asked questions
Can partial discharge be located with coupling capacitors alone?
Only partially. Coupling capacitors are installed at the line terminals and attenuation limits their reach to the 10–15 % of the winding closest to the terminal. They are useful for detecting activity, but a defect located deep inside the winding may go unnoticed. Locating it requires adding sensors distributed through the slots.
Why use the RTDs already installed as partial discharge sensors?
Because they sit inside the slots and are distributed along the winding — exactly where you need to look. With the RMM’s RTD-PD module, the existing temperature RTDs are reused as PD sensors, which greatly extends winding coverage without rewinding the machine or installing a stator slot coupler at every position.
How do you tell an internal void from a loose winding?
By the phase pattern and the response to operation. Balanced polarities and a good correlation with operating parameters point to internal voids in the insulation. A loose winding, by contrast, is sensitive to mechanical forces: if PD activity is unaffected while monitoring a start, the winding is firm and the origin is more likely a void.
What is the difference between an RTD and a stator slot coupler (SSC)?
Sensitivity is almost identical and the patterns virtually match, as figure 4 shows. The relevant difference is geometric: the RTD occupies a symmetrical position between bars and the SSC an asymmetrical one, and the top bar partially shields the bottom bar’s PD from the SSC. Comparing both helps decide whether the defect is in the top or the bottom bar.
When is continuous monitoring preferable to periodic measurements?
When the machine is critical, its replacement lead time is long, or the cost of a forced outage is high. The 13.8 kV motor case illustrates it: it was precisely the continuous trend after the outage that proved the repair had not addressed the real source of the problem — something a spot measurement would not have revealed.
Equipment and advice
The rotating machine monitor (RMM) performs continuous partial discharge monitoring and also logs and correlates the operating dynamics of the motor or generator, including variable frequency drive (VFD) applications. You can also browse the rest of our partial discharge detection equipment, as well as our more general article on partial discharge analysis.
Do you have a motor or generator with growing PD activity and need to know where the defect is? Contact our engineers and we will advise you on the most suitable instrumentation and measurement plan.
Sources
Dynamic Ratings — “Partial Discharge Monitoring Saves 13.8 kV Motor” and “Use of Stator Slot Couplers and RTDs with Coupling Capacitors for Thorough Partial Discharge Activity Sensing”. Images reproduced from those case studies.